 Home
Home

 Artists
 Search
 Recent
 Random
 Posts
Posts
 DMs
DMs
 Tags
Tags
 Random
 Importer
 Import
 FAQ
FAQ
 Account
 Register
 Favorites
 Login
Login

Bitcoin Power Law (Patreon)
Content
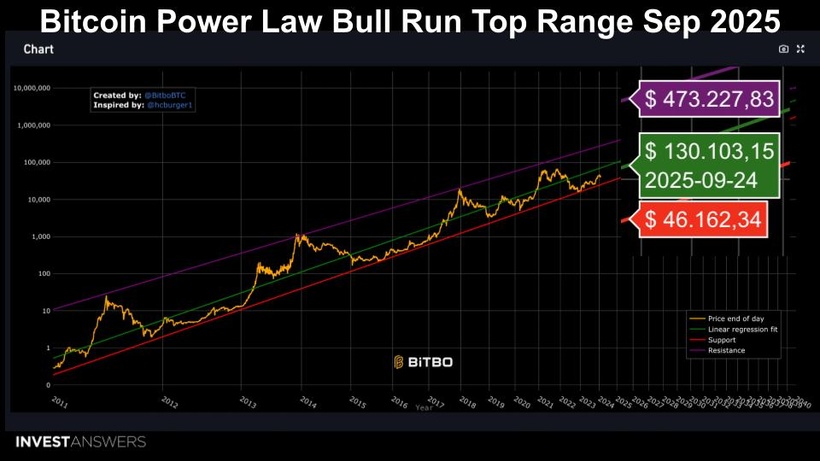
This chart explains Bitcoin price with 95% accuracy over the last 15 years. Can it hold? We shall see.
The Bitcoin Long Term Power Law chart is created by plotting two linear regression lines - a support line below the current price and a resistance line above it, based on Bitcoin's historical prices. This chart suggests that Bitcoin's price will not fall below $100,000 after 2028 and will reach a minimum of $1,000,000 between 2028 and 2037, never dropping below this level thereafter. However, these predictions are based on past Bitcoin performance and assume similar future trends, acknowledging that unforeseen events could significantly alter this trajectory.
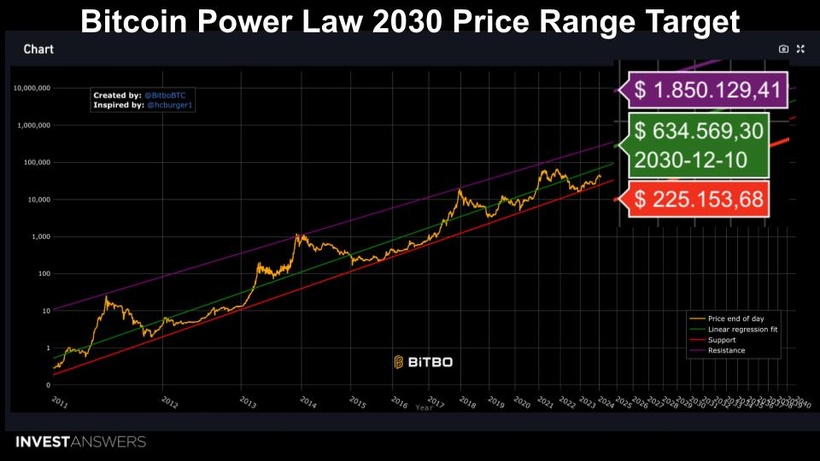
I ran two projections - Bull Run Top Range using this and also 2030. Maybe Hopium but interesting nonetheless.
Note the ETF changes the calculus big time.... Supply Crunch Coming.
2025 BULL MARKET TOP IF WE HAVE ONE
Mid range expectation 130K
2030 RANGE
Mid range expectation 635K
Files
